A.I.R.
Graphic Design +Infographics + Survey Design + User Testing
About the Project:
This project was funded by a grant to redesign and simplify a medical product to help increase the birth survival rates in Uganda. This product was an infant resuscitation device. A team of engineers came to our design team and needed help with the ergonomics of the product as well as visual elements. The goal was to add a digital element to aid in user error and help make the product design more simplistic and create icons and infographics that were easy to understand in a third world country.
My Role:
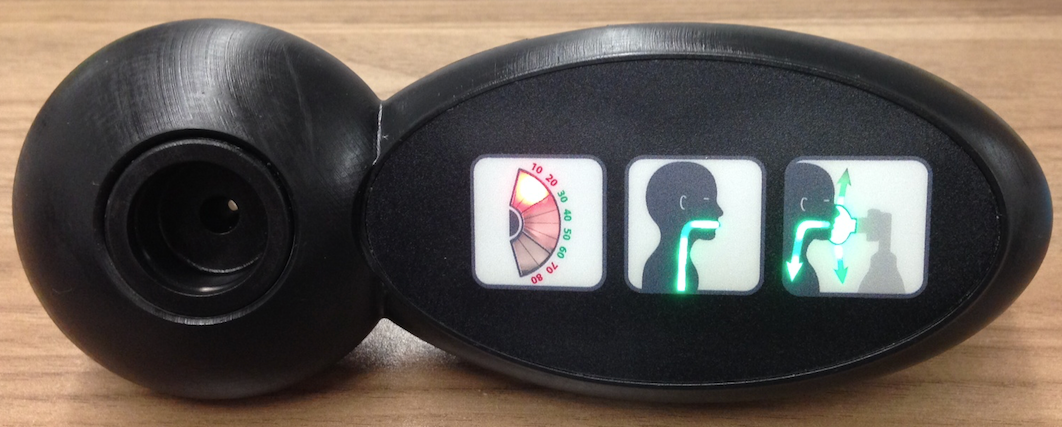
As the only UX designer on my team, I had to wear many hats. I was the user researcher, creating surveys for the team to use on their trip to Uganda and synthesized user feedback when the team returned. I was a graphic/ UI designer, creating many graphic iterations for the equipment and animated GIF's to help simulate a real life experience interface. I was also the prototype photographer as well, helping to document the multiple rounds of product iterations.
Objective:
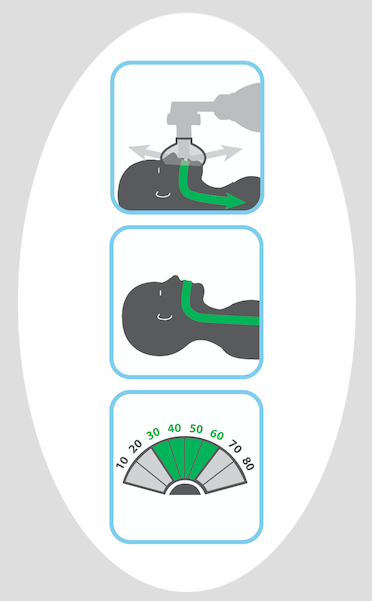
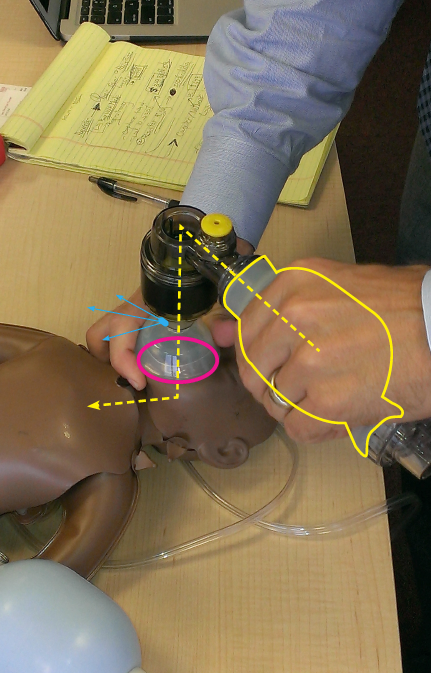
Adding a digital component to the existing Ambu Bag (resuscitation device) that is on the market today. Image on right: Blue = Help device detect leaks; Pink = Create a better seal around the infant and the mask; Yellow = Measure airflow and rate of airflow (fast vs. slow)

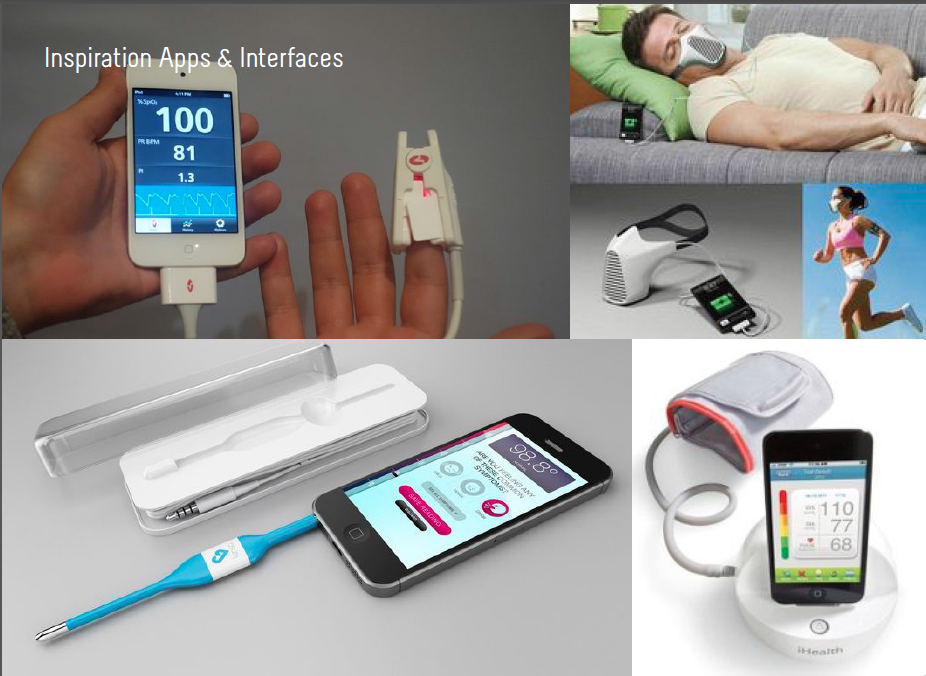
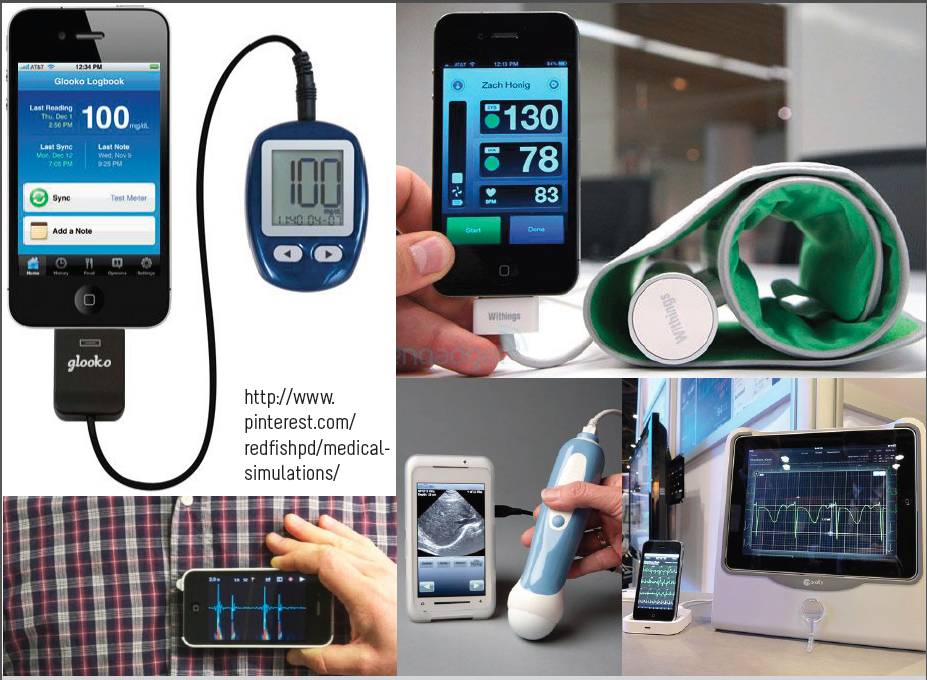
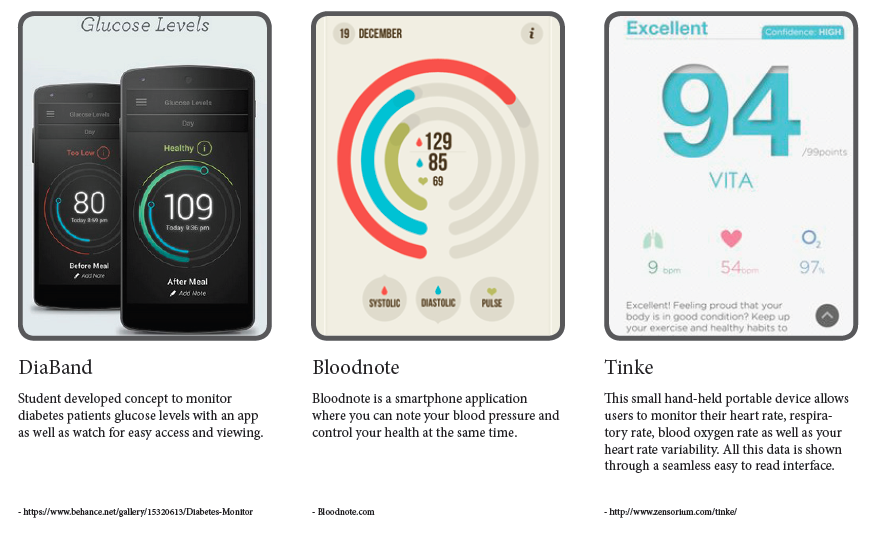
Medical Product UI Inspiration
Visualizing invisible air
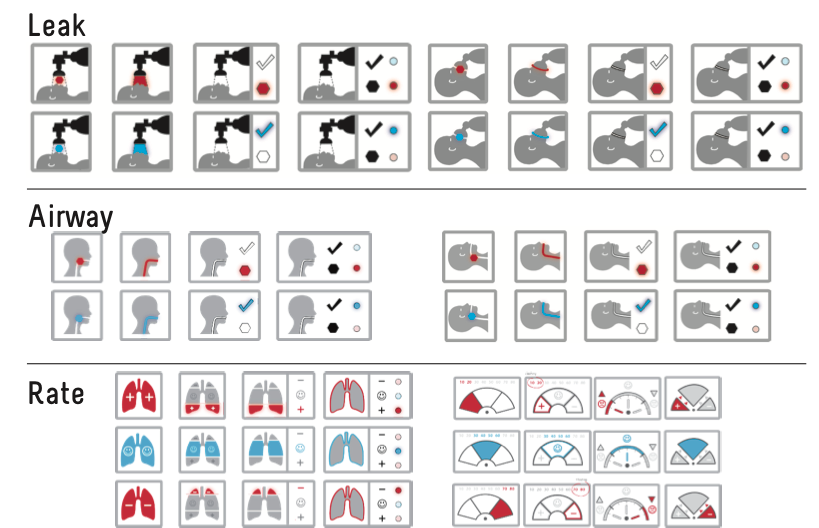
As the graphic / interface designer, I designed all of the graphics using Adobe Illustrator. The biggest challenge for the design of the equipment was visually showing the users how to universally use the tool without using words to describe the process, hence the design had to be very intuitive. Below is a sample of the original icons for each of the three categories.
Phase 2: Survey Comparison and feedback
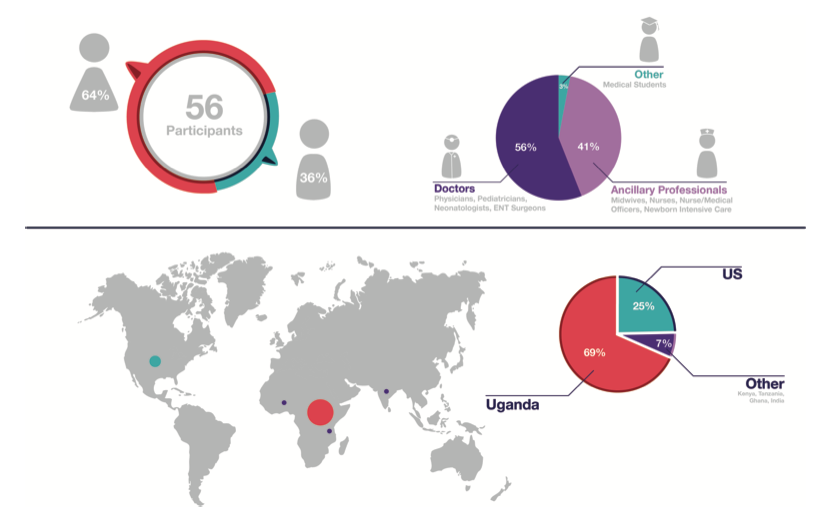
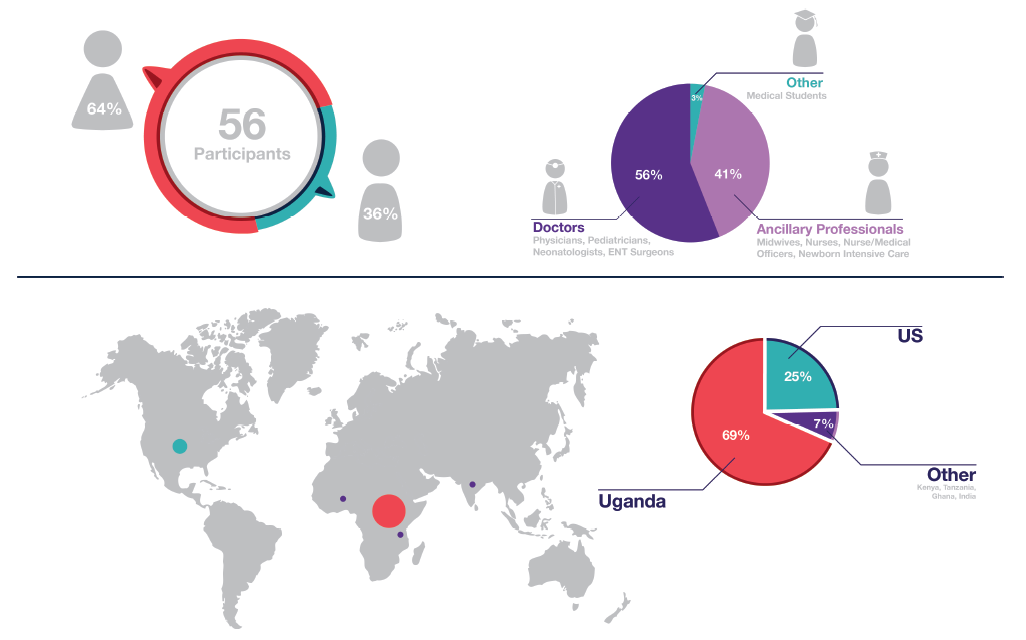
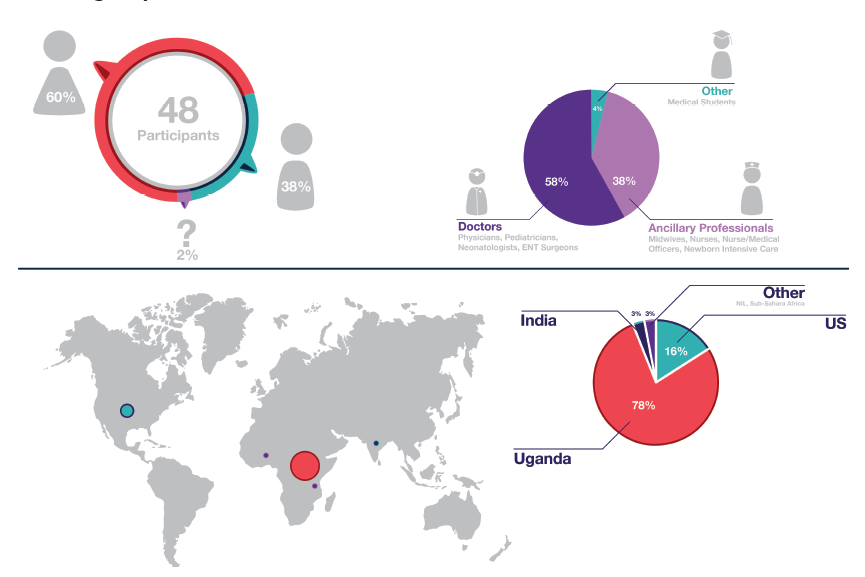
A team of doctors traveled to Uganda and printed these surveys, asking caregivers, nurses, and doctors what various icons meant after showing them the prototype of the tool. Below is a sample of two rounds of the surveys. I also designed the infographics here to visually show who was participating each survey. Many survey takers had a translator to help with the survey language. Note: Below are samples taken from the survey. Leak, Airway and Rate were tested in both surveys.
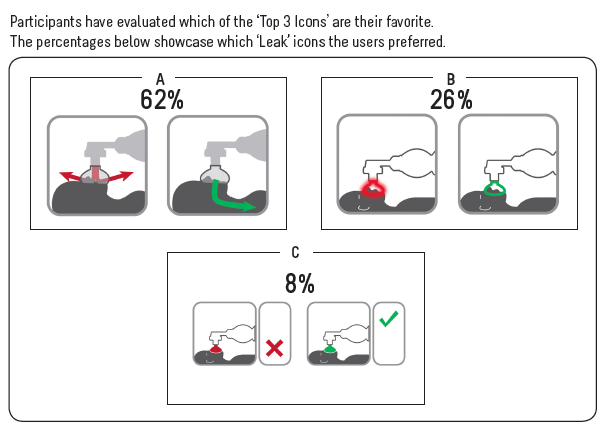
Survey A: 'Still Image' Graphic Survey
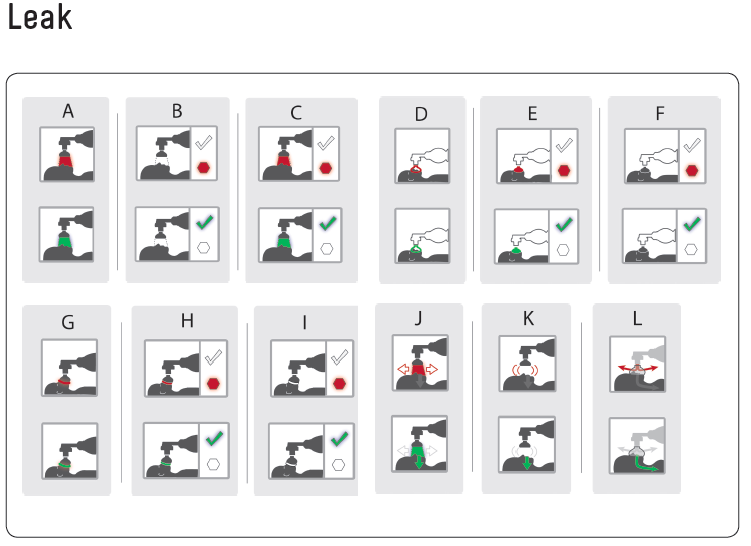
User Feedback: Survey A
“I like C, but I would change the correct positioning so that the mask is actually on the infant/ child’s mouth and put the green color as going to the trachea.”
“I think L is the clearest. However for the ‘leak’, I would draw the red arrows such that they show the air leaking out from UNDER the mask (i.e. a small space between the face and the mask. Currently the red arrows are shown THROUGH the mask’s plastic, which I think is a bit unclear of a true leak.”
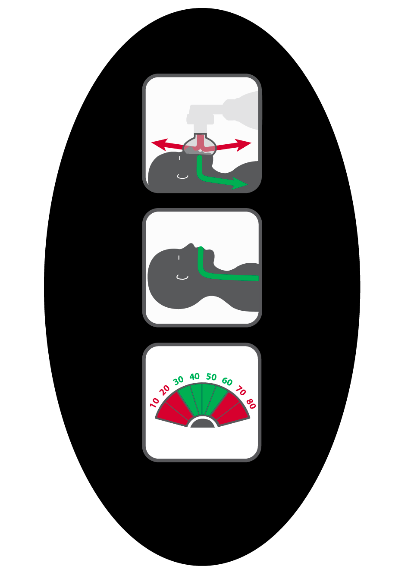
Survey B: 'Animation' Graphic Survey
User Feedback: Survey B
“The shade of red and green you selected is not distinguishable to those of use with red/green color blindness. The flashing color on icon B is the only way I can tell which one is the leak.”